A new monthly close brings a new update to any indicators using the end of a month’s trading in their analysis. For our PowerTrend indicator the close updates the monthly charts used in conjunction with a 10-month Moving Average. With the monthly close and Moving Average we create an easy to decipher ‘Buy Signal’ or ‘Sell Signal’ based on this information.
With our PowerTrend signals in mind let’s review the $SPX monthly chart and the accompanying 10-month Moving Average. We look at where the most recent month closed in relation to the Moving Average. So we’ll wait for the last trading day in April 2026 for the next update in this indicator.
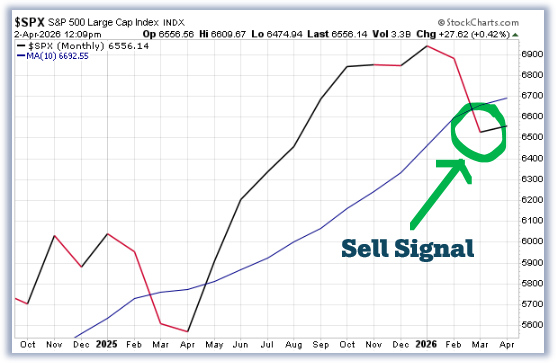
With the last trading day in March 2026 the PowerTrend Sell Signal appeared! Now what?
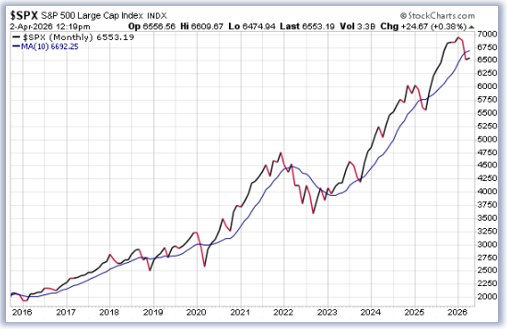
- Don’t panic! Sell Signals are a part of the market experience. Let’s review this chart in a wider lens. Sell Signals happen, just like Buy Signals!
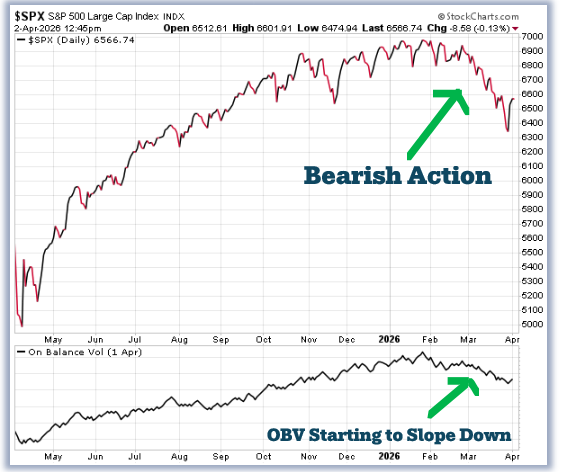
2. Adjust expectations. Durations of signals vary. As positions with profit potential shift bearish conditions can stay or vanish. Below highlights the recent bearish movement in the past year.
3. Review bearish strategies. Put options and put option debit spreads are both bearish strategies that can be quickly deployed in the ‘Sell Signal’ fueled market.
If you’re interested in similar methodology it may be worth exploring the Markham Trading Option Edge Newsletter. For ONLY $1 in your first month, you’ll get a detailed breakdown of Blane’s top trade idea each week—including the exact structure and reasoning behind the trade. It’s a straightforward way to stay connected to actionable ideas without overcomplicating the process. Click here to get signed up today!
Wishing You the Best in Investing Success,
The Markham Trading Team
Have any questions? Email us at support@markhamtrading.com
*Trading incurs risk and some people lose money trading.
Leave a Reply