Blog

  • Option Debit Spread Strategy

    A defined-risk options strategy that profits when a stock goes up, stays flat, or even drops modestly — using two in-the-money calls and disciplined sizing.

    Strategy: In-the-money vertical debit spread  |  Outlook: Neutral to bullish  |  Risk: Defined / capped  |  Profits if: Stock up, flat, or down about 10%


    1. The Idea

    The defining feature of the in-the-money debit call spread is that the stock can finish at expiration up, flat, or down by as much as ten percent and the trade still produces its full intended return.

    That is a different proposition from buying a call outright, where you need a clear move higher just to recover the premium you paid. It is also different from owning the stock, where any decline is a dollar-for-dollar loss against capital that is many times larger than what the spread requires.

    The structure: you buy a deep in-the-money call and you sell another in-the-money call at a higher strike. Both strikes are below the current stock price. Your maximum loss is the net debit you paid. Your maximum profit is collected any time the stock closes at or above the higher of the two strikes at expiration, which gives the trade meaningful room to be wrong on direction and still be right on outcome.

    2. Anatomy of the Spread

    Both legs are in the money. The long strike sits well below the current price; the short strike also sits below the current price, but closer to it. The stock starts the trade already inside the maximum profit zone.

    Example construction with the stock trading at $125:

    Leg Strike Cost / Credit
    Buy (long) $100 call — deep ITM, high delta -$25.50
    Sell (short) $110 call — ITM, closer to money +$17.50
    Net debit (your maximum loss) $8.00 / share — $800 per spread

    Three numbers fall out of this construction and define everything that follows:

    • Maximum loss: the net debit. Here, $800 per spread.
    • Maximum profit: spread width minus debit. Here, ($110 – $100) – $8 = $2.00 per share = $200 per spread.
    • Breakeven at expiration: long strike plus debit. Here, $108. The stock can fall 13.6% from $125 and the trade still breaks even.

    3. Why Both Strikes Are In the Money

    Beginners often build call spreads with strikes near or above the current price. That trade is cheaper to enter and has more theoretical upside, but it needs the stock to move higher to pay out. If the stock stays flat or drifts lower, the trade decays.

    The in-the-money construction inverts that relationship. The long leg sits deep enough below the current price that its delta is roughly 0.85 or higher and its premium is almost entirely intrinsic value — money you already own as soon as the position opens. The short leg sits above the long leg but still below the current price, capping the spread payoff and collecting the time-value premium another trader is paying for hope.

    Because both strikes are below where the stock is trading today, the stock is already inside the maximum profit zone the moment the position is established. The trade is then a waiting game. Time passes, the short leg time value decays toward zero, and as long as the stock holds above the short strike at expiration, the spread converges to its full intrinsic value and closes at maximum profit.

    The downside cushion is the gap between today’s price and the breakeven. In the structure above, the stock can fall roughly 14% before the trade hits breakeven, and roughly 20% before the trade hits maximum loss. That is the protection that is missing from a long call or a stock position of comparable size.

    4. How to Execute the Trade

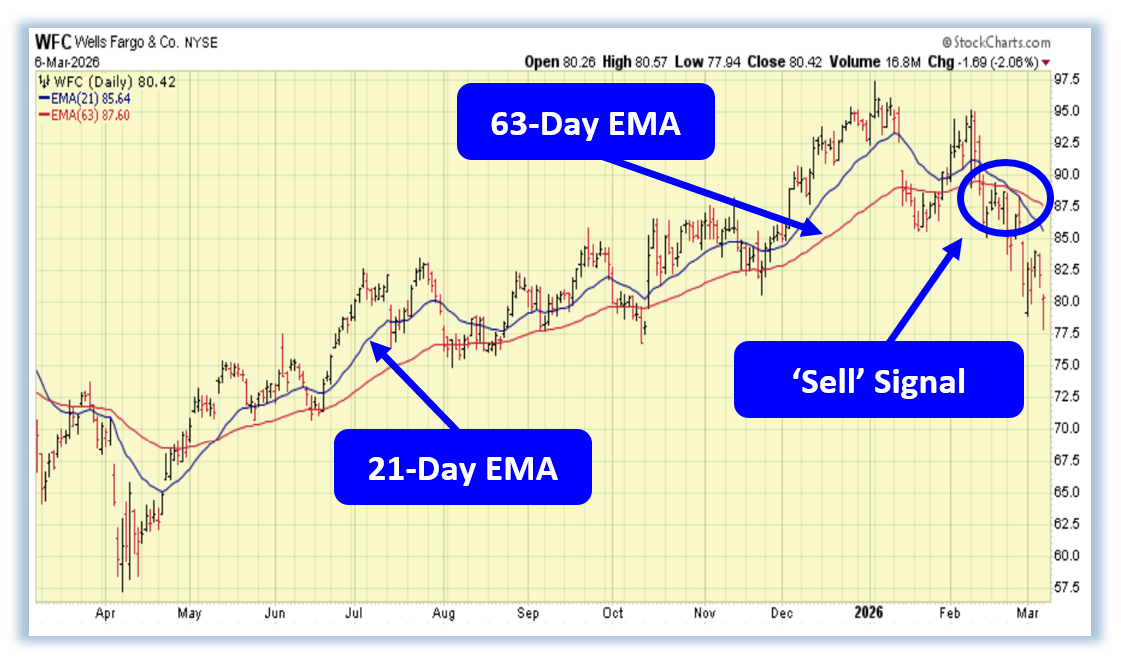
    1. Confirm the trend. The 50-day EMA must be above the 100-day EMA. The stock should be trading inside its Keltner Channels, ideally in the upper half, showing strength without being extended above the upper band. That combination defines the buy signal. No signal, no trade.
    2. Set the timeframe. One to three months to expiration is the working range. Whenever practical, lean toward the shorter end — the strategy makes its return faster with less capital tied up.
    3. Select the long strike. Buy a deep in-the-money call, well below the current stock price. The depth gives the long leg a high delta and minimal time value, which is what makes the spread behave the way it does.
    4. Select the short strike. Higher than the long strike, but still in the money — below the current stock price. The short strike defines the top of the maximum profit zone.
    5. Verify the economics. Target a minimum 25% return on the spread. Place the order as a net debit limit at the midpoint between bid and ask, not at market. Tight execution is meaningful — the bid-ask spread on options is wider than it looks.
    6. Size to the position rule. No single trade risks more than 10% of trading capital. Spread that across at least ten positions, not into one. Diversification is the second half of the strategy, not an afterthought.
    7. Define the exits in advance. Take profit when the spread reaches roughly 80% of its maximum value. Cut a losing trade at 25 to 30% loss; be out definitively at -35%. Set the rules before you need them.

    5. Worked Example

    Stock XYZ trades at $125. The 50-day EMA is above the 100-day EMA. Price is holding in the upper half of its Keltner Channels — a confirmed buy signal. With about ninety days to expiration, the spread is constructed as follows:

    Buy XYZ 100 Call -$25.50
    Sell XYZ 110 Call +$17.50
    Net debit (maximum loss) $800
    Maximum profit at expiration $200
    Breakeven price $108.00
    Return on risk 25%

    The headline number is the breakeven: $108. The stock is at $125 today. It can fall by more than 13% and the trade still produces a profit. It can sit flat for ninety days and produce its full $200 return. As long as it closes above $110 at expiration, the trade pays its maximum.

    6. Outcomes at Expiration

    The same trade, evaluated across the full range of possible closing prices for XYZ ninety days from now:

    Stock Move Closing Price P/L per Spread Return on Risk
    Up 8% $135.00 +$200 +25.0%
    Flat $125.00 +$200 +25.0%
    Down 5% $118.75 +$200 +25.0%
    Down 12% $110.00 +$200 +25.0%
    Breakeven $108.00 $0 0.0%
    Down 16% $105.00 -$300 -37.5%
    Down 20% or more at or below $100 -$800 -100%

    Compare to the alternatives. Buying 100 shares of XYZ at $125 commits $12,500 of capital and loses dollar-for-dollar on any decline. Buying a long call alone needs an upward move just to recover the premium paid. The spread risks $800 and asks the stock to do almost nothing.

    7. Risk Discipline

    The edge of the in-the-money debit spread comes from a high win rate across many positions, not from outsized winners on any one. That makes position sizing and exit discipline structural, not optional.

    Position Sizing: 10% Maximum

    No single trade carries more than ten percent of trading capital. Spread risk across at least ten positions. If the account is $20,000, no individual spread costs more than $2,000.

    Defined Exits: Set Before Entry

    Close winners when the spread reaches roughly 80% of its maximum value — the last 20% of the move requires holding through expiration with capital tied up. Cut losers at 25 to 30% loss on the debit, and be out definitively by -35%. These rules go in before the trade does, not after the position is moving against you.

    The high win rate is what makes the math work. Because the spread can produce its full return when the stock is up, flat, or down within the cushion, far more trades end as winners than losers. With both sides of the ledger sized similarly per trade, that win rate is the edge.

    8. Bottom Line

    The in-the-money debit call spread is one of the most durable structures in options trading because it does not require the stock to move in your favor — only to not move sharply against you. Built with both strikes below the current price, sized at no more than 10% of capital per trade, and held to disciplined exit rules, it gives a trader a high-probability framework for participating in trending markets without overcommitting capital.

    It will not replace the work of reading the chart, the macro, and the risk. It will not make every trade a winner. What it will do is give a structure that respects the account first and the upside second. That is the order that matters.


    From the Markham desk

    We built a service around this strategy.

    Finding stocks with the right trend structure, comparing strike combinations to hit the 25% return target, and tracking exits across a portfolio of spreads takes real daily work. So we built a service that does it.

    AutoStrike is a collaboration between Chuck Hughes and Markham Trading. It scans the Russell 1000 each morning using Chuck’s proprietary indicator, ranks the buy signals by strength, and delivers three vetted in-the-money debit spread picks per trading day — with strikes, prices, and targets fully calculated. The same strategy described on this page, delivered as a daily pick list.

    See AutoStrike →

    EDUCATIONAL CONTENT ONLY. NOT FINANCIAL ADVICE. Options trading involves substantial risk of loss and is not appropriate for every investor. The strategies and examples described are for educational purposes; past performance does not guarantee future results. Consult a licensed financial professional before making investment decisions.

  • Using the ProfitSurge on the $SPX

    Another Monday and another week of trading unfolds before us! Charts across many sectors have transitioned from steady uptrends into choppier trades retreating from the resistance. That type of behavior often signals a market reassessing its strength. When momentum begins to fade after an extended run, experienced traders tend to pay close attention to the emerging trend structure and trade alongside it. Let see what the $SPX chart is showing us.

              When the 21-day Exponential Moving Average crosses above the 63-day Exponential Moving Average a ProfitSurge ‘Buy Signal’ triggers.

              For a ‘Sell Signal’, the 21-day EMA crosses below the 63-day EMA.

    When the recent ProfitSurge ‘Sell Signal’ formed the $SPX continued the series of lower highs and lower lows. This set up signals for bearish option positions to match the $SPX’s overall trend.

    Looking at individual securities in this trend could lead to an in-the-money put debit spread, which defines risk while allowing participation if the trend continues lower. Because the put spread sits In-the-Money the structure provides some cushion in the event of another oversold bounce before the broader move unfolds. For put options In-the-Money, or ITM, options are the strikes higher than the current market price of the underlying. With the strategy rules used these ITM put debit spreads could hold potential returns if the underlying declines, remains, or even rises at option expiration. This builds the margin of error into the trade as it’s developed.

    For traders who enjoy seeing how we identify these types of setups directly from the tape, our Options Edge Newsletter goes deeper. Each week we send members multiple actionable trade ideas with full option structures and detailed technical breakdowns. Right now, a one month subscription is available at a substantial discount for readers looking to sharpen their trading edge. Lock in your deal for this newsletter today!

    Wishing You the Best in Investing Success,

    The Markham Trading Team

    Have any questions? Email us at support@markhamtrading.com

    *Trading incurs risk and some people lose money trading.

  • The Chart Signaled a ‘Sell Signal’? Now What?

    A new monthly close brings a new update to any indicators using the end of a month’s trading in their analysis. For our PowerTrend indicator the close updates the monthly charts used in conjunction with a 10-month Moving Average. With the monthly close and Moving Average we create an easy to decipher ‘Buy Signal’ or ‘Sell Signal’ based on this information.

    With our PowerTrend signals in mind let’s review the $SPX monthly chart and the accompanying 10-month Moving Average. We look at where the most recent month closed in relation to the Moving Average. So we’ll wait for the last trading day in April 2026 for the next update in this indicator.

    With the last trading day in March 2026 the PowerTrend Sell Signal appeared! Now what?

    1. Don’t panic! Sell Signals are a part of the market experience. Let’s review this chart in a wider lens. Sell Signals happen, just like Buy Signals!

    2. Adjust expectations. Durations of signals vary. As positions with profit potential shift bearish conditions can stay or vanish. Below highlights the recent bearish movement in the past year.

    3. Review bearish strategies. Put options and put option debit spreads are both bearish strategies that can be quickly deployed in the ‘Sell Signal’ fueled market.

       If you’re interested in similar methodology it may be worth exploring the Markham Trading Option Edge Newsletter. For ONLY $1 in your first month, you’ll get a detailed breakdown of Blane’s top trade idea each week—including the exact structure and reasoning behind the trade. It’s a straightforward way to stay connected to actionable ideas without overcomplicating the process. Click here to get signed up today!

      Wishing You the Best in Investing Success,

      The Markham Trading Team

      Have any questions? Email us at support@markhamtrading.com

      *Trading incurs risk and some people lose money trading.

    1. Smart Money Is Quietly Exiting This Name

      Smart Money Is Quietly Exiting This Name

      There’s been a marked shift developing beneath the surface in parts of the services and software space, particularly among companies tied to employment trends. The tape has been very unforgiving toward businesses that rely on steady labor expansion, as hiring momentum has flattened out and forward expectations have cooled. What’s notable is how quickly investors have rotated away from these names, even as broader indices attempt to stabilize. It’s not outright panic—more a quiet repricing of growth assumptions tied to the labor cycle.

      One name that surfaced in today’s review is Paychex (PAYX). The backdrop is challenging: a stalled “no hire, no fire” labor environment now showing early signs of contraction, paired with longer-term concerns around AI-driven disruption in payroll and HR services. Price has reflected that pressure, carving out a steady sequence of lower highs and lower lows since its June peak, with little evidence of sustained buying interest. More telling is the OBV line, which has continued to drift lower throughout the decline and barely responded during recent rallies—suggesting institutions have yet to step in with conviction.

      From a trade construction standpoint, this type of orderly downtrend lends itself to defined-risk bearish positioning, particularly through put options. Rather than trying to time an exact top or bottom, the focus shifts to participating in continuation while clearly defining downside exposure. In this case, a put structure offers asymmetry—if the stock were to decline by roughly 10% into expiration, the option setup could translate to a gain in the neighborhood of 88.9%, though outcomes will ultimately depend on timing, volatility, and price path. It’s less about prediction and more about aligning risk with a prevailing trend that hasn’t yet shown signs of reversal.

      If you find yourself drawn to setups where the technicals and macro narrative are aligned like this, it may be worth exploring my Option Edge Newsletter. For ONLY $1 in your first month, you’ll get a detailed breakdown of my top trade idea each week—including the exact structure and reasoning behind the trade. It’s a straightforward way to stay connected to actionable ideas without overcomplicating the process. Click here to get signed up today!

      Wishing You the Best in Investing Success,

      Paycheck's OBV line confirms the bearish trend for the stock.

      Blane Markham

      Chief Trading Strategist

      Have any questions? Email us at support@markhamtrading.com

      *Trading incurs risk and some people lose money trading.

    2. Bank Stocks Are Starting to Roll Over

      Bank Stocks Are Starting to Roll Over

      Leadership within the financial sector has noticeably cooled to start the year. After a powerful run through much of last year, many of the large banks have slipped into steady distribution as buyers have become less aggressive on rallies. The tape lately has reflected more defensive positioning, with weakness appearing on even modest bouts of economic concern and fears about the industry’s ties to potential issues in private credit. In this environment, certain names are beginning to separate from the pack on the downside.

      One that recently stood out on the technical front is Wells Fargo & Co. (WFC). The shares have carved out a clear pattern of lower highs and lower lows since the start of the year, reflecting fading demand from buyers. More recently, my Profit Surge system flagged a fresh sell trend as the 21-day EMA crossed below the 63-day EMA, with price now trading beneath both averages. When that type of alignment occurs within an already declining structure, it typically signals that downside momentum is beginning to take control of the tape.

      From a trading standpoint, the view here leans bearish, and one straightforward way to express that bias would be through put options. Bank stocks often carry relatively modest time value, which can limit the attractiveness of spread trades, so a simple directional structure can sometimes be the cleanest approach. If the current decline were to continue, the puts would participate in that downside move while keeping risk defined to the premium paid. In fact, one available put contract currently offers a potential return of roughly 98.0% if the shares were to decline another 10% by expiration, illustrating how even a measured continuation of the trend could create meaningful leverage.

      If you enjoy uncovering trade setups like this one, you may want to take a look at my Weekly Profit Opportunity Newsletter. For just $1 for your first month, you’ll see the exact trade I’m focused on each week—including the technical breakdown and full options structure—Of course there are winners and losers just like any system, but a recent alert produced a 104.5% profit opportunity. Begin your $1 trial period today!

      Wishing You the Best in Investing Success,

      Blane Markham

      Chief Trading Strategist

      Have any questions? Email us at support@markhamtrading.com

      *Trading incurs risk and some people lose money trading.

    3. Under The Radar A.I. Play Pops

      Under The Radar A.I. Play Pops

      Market leadership continues to show up in places many traders ignored during last year’s mega cap dominated tape. Capital has decisively rotated back into infrastructure-style names tied to the A.I. economy, and the tape has started to reward that patience. Several key charts in the group are now reclaiming trend structure that had been absent for most of 2025. When accumulation returns to these kinds of assets, the price action often becomes far more orderly than the broader market.

      One name that recently pushed its way onto the radar is Digital Realty Trust, Inc. (DLR). After spending much of 2025 trading quietly and even sliding into year-end, the stock has started this year with notable strength and recently broke out to fresh 52-week highs. Just as important, shares have reclaimed all of their major moving averages, restoring structural support beneath the trend. Meanwhile the On-Balance Volume line has been climbing steadily since the December lows, a sign that larger investors have been accumulating shares and helping reinforce the bullish tape.

      With the stock approaching the $200 level, outright call options can become expensive—particularly in a market where volatility keeps time premium elevated. Rather than chase premium, a defined-risk approach such as an in-the-money call option debit spread can allow participation in continued upside while reducing upfront cost. One spread currently available offers roughly a 51.5% potential return if DLR is up, flat, or even down by as much as 10% by expiration, illustrating how a carefully structured options position can create a more forgiving payoff profile around a strong trend. In other words, the trade isn’t dependent on a runaway move — it simply requires the broader structure to remain intact.

      For readers who enjoy how we break down charts and turn them into actionable trade structures, our Options Edge Newsletter shows exactly how our team approaches these opportunities each week. Every edition highlights multiple setups we’re tracking and the precise strategies we’d consider trading. Right now, you can access the first four weeks for just $1, giving you a full look at how we translate market observations into real trade ideas. Don’t wait, kickoff your trial period today!

      Wishing You the Best in Investing Success,

      Blane Markham

      Chief Trading Strategist

      Have any questions? Email us at support@markhamtrading.com

      *Trading incurs risk and some people lose money trading.

    4. Quantum Hype Meets Harsh Market Reality

      Quantum Hype Meets Harsh Market Reality

      Speculative technology groups that captured attention last year have inarguably lost their mojo as the market’s tone shifted toward profitability, balance sheet strength, and durable earnings growth. As that rotation has unfolded, many of the more narrative-driven thematic stocks have struggled to regain traction. The tape has been particularly unforgiving to companies still operating in early-stage development cycles. When sentiment pivots like this, trend persistence often becomes the dominant force driving price action.

      That backdrop helps explain why IonQ Inc. (IONQ) surfaced on today’s scan. After peaking last September, the stock has steadily deteriorated alongside much of the quantum computing basket and now sits more than 50% below its 52-week high. The defining signal came when its 1-Month Price moved beneath the 10-Month SMA, triggering a PowerTrend “Sell” signal back in January. Rather than stabilizing, the gap between price and that longer-term average has continued to widen, reinforcing the bearish structure.

      Even with that trend firmly pointed lower, simply purchasing puts isn’t the most efficient approach right now because option premiums carry considerable time value. A more balanced expression could be an in-the-money put debit spread, pairing a long higher-strike put with a short lower-strike put to define risk while reducing upfront cost. Structures like this can still participate meaningfully if the decline continues while offering some tolerance if the stock chops sideways. At current pricing, one such spread offers roughly 51.5% potential return if the stock drifts lower, stays relatively flat, or even rebounds modestly by roughly 10%.

      For traders who appreciate this type of chart-driven opportunity, our Options Edge Newsletter walks through setups like this each and every week. Right now readers can try it for $1 for the first month — just $0.25 per week — and receive four weeks of trade ideas and chart breakdowns. It’s a simple way to see how our team spots opportunities and structures actionable trades in real time. Gain access to these trade ideas today!

      Wishing You the Best in Investing Success,

      Blane Markham

      Chief Trading Strategist

      Have any questions? Email us at support@markhamtrading.com

      *Trading incurs risk and some people lose money trading.

    5. This Cruise Stock Just Flipped Bearish

      This Cruise Stock Just Flipped Bearish

      Travel and leisure names have seen a noticeable shift in tone lately as the market rotates away from some of last year’s stronger consumer recovery themes. Several charts across the group have transitioned from steady uptrends into choppier trades with rallies increasingly running into overhead resistance. That type of behavior often signals a market that is beginning to reassess prior strength. When momentum begins to fade after an extended run, experienced traders tend to pay close attention to the emerging trend structure and trade alongside it.

      One chart that recently moved onto our radar is Royal Caribbean Cruises (RCL). Over the past six months the stock has experienced significant volatility in both directions, including a sharp decline through Q4 followed by a short-lived recovery attempt earlier this year. That rebound stalled in mid-February after running into heavy resistance, and the shares have since resumed their downward trajectory. Just last week the 21-day EMA crossed below the 63-day EMA, triggering a fresh ProfitSurge ‘Sell’ signal — a negative convergence that often reflects a market shifting into a pattern of lower highs and lower lows.

      Given that backdrop, the setup lends itself to a bearish options structure while still accounting for the stock’s recent volatility. One approach would be an in-the-money put debit spread, which defines risk while allowing participation if the trend continues lower. Because the put spread sits ITM, the structure provides some cushion in the event of another oversold bounce before the broader move unfolds. At current pricing there is a spread that could offer roughly 52.7% potential return if RCL shares decline, remain flat, or even rise modestly by around 10%, illustrating how the position builds a margin of error into the trade idea.

      For traders who enjoy seeing how we identify these types of setups directly from the tape, our Options Edge Newsletter goes deeper. Each week we send members multiple actionable trade ideas with full option structures and detailed technical breakdowns. Right now, a one month subscription is available at a substantial discount for readers looking to sharpen their trading edge. Lock in your deal for this newsletter today!

      Wishing You the Best in Investing Success,

      Blane Markham

      Chief Trading Strategist

      Have any questions? Email us at support@markhamtrading.com

      *Trading incurs risk and some people lose money trading.